
One chart, not six.
Not just an indicator. A system. The layers professionals read, written from scratch on one shared engine, in one visual language, on the chart you trade.
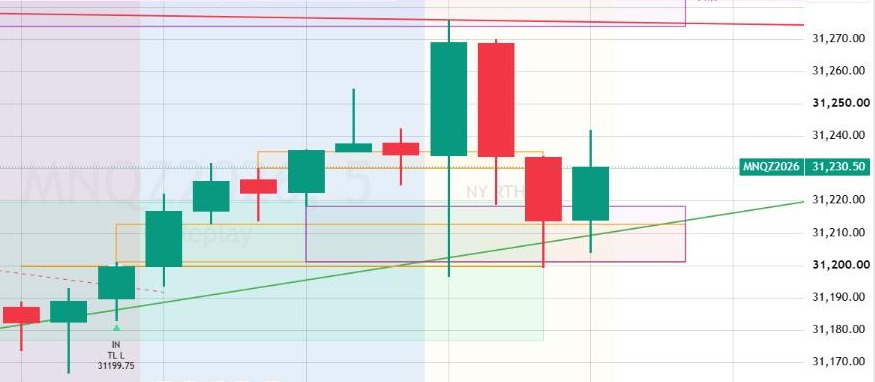
Add a layer. Never leave your chart.
Higher timeframe gaps, levels, CRT and structure print directly on the chart you trade. No more flipping charts, no more losing the setup while you look elsewhere.
Real TradingView capture (Bar Replay), MNQ 5 min, October 8, 2026, 9:45 ET: the 5-minute gap (orange) and the 15-minute gap (purple) sit in the same zone, on the same chart. Illustration only, not a trading result.
The full map of the market
Each one works on its own, and all of them work together. Included in both Core and Pro. Use the tools you prefer. Team them up: 2, 4, or all 13.
Sessions
Know at a glance which market is in control right now.
Opening range
The session's first battle lines, drawn for you.
Previous highs and lows
The levels the market remembers: day, week and month.
Session highs and lows
Where every session left its marks, and where today's is building.
Liquidity pools
Where the stops are waiting, before price gets there.
Liquidity sweeps
See the moment the stops were taken.
Market structure
Trend continuation or shift, confirmed by closes, not wicks.
Fair value gaps
Where price left unfinished business, on up to five timeframes at once.
Equilibrium
Buying at a discount, or chasing at a premium? Know before you act.
Candle range theory
Higher timeframe setups, on the chart you trade.
SMT divergence
See relative strength or weakness between markets as it develops.
Trendlines
Precise lines drawn for you, and you see which ones broke.
Day type
Trend day or range day? Know early, adapt your plan.
Made for your market, your session, your style.
Trader Edge Suite is built for different traders, markets and sessions, not one personal setup. Choose which modules you see, the timeframes each module reads, and every color, line style, thickness and label size.
Each setting is numbered in the panel (for example 8.3 is module 8, setting 3), so you find any setting in seconds.
- Full visual customization: colors, styles, sizes, history, every module on or off
- Works on NQ and MNQ, ES and MES, gold, crude and more
- From 1-minute charts upwards
- Light and dark chart themes
- On-chart notes that guide your setup
- The Official Guide: every module and preset explained, with your chart open
- All updates included while your subscription is active
7 execution presets. The map plus execution.
Each preset waits for a complete setup built from the modules, marks the moment you could initiate a trade (IN) at the exact price and alerts you. Because every module is one click away on the same chart, you can add confluence to any IN in a fraction of a second.
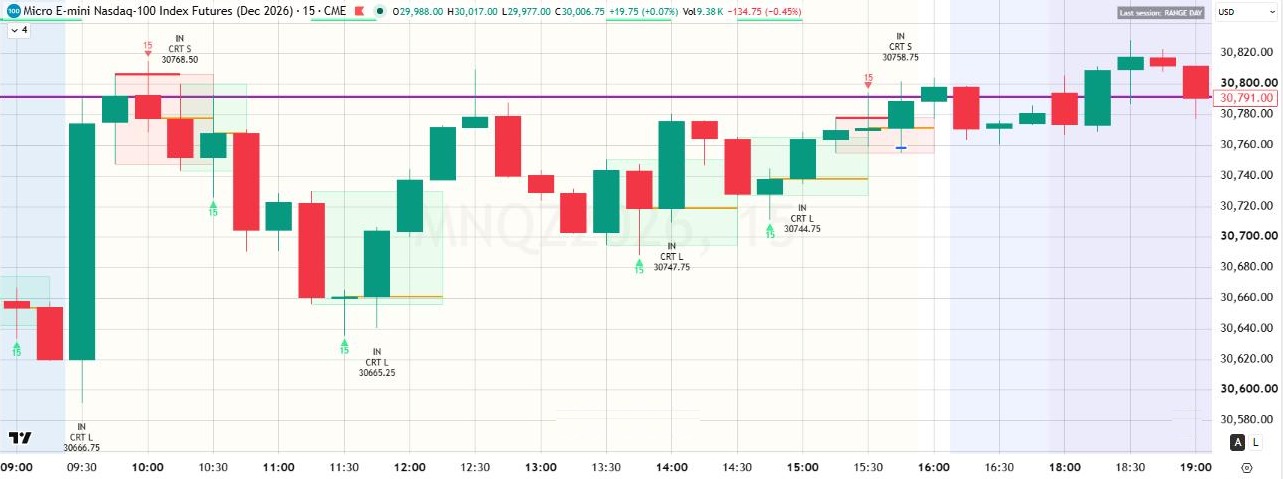
Real capture, MNQ 15 min, Oct 13, 2026. Click or tap to enlarge. Illustration only, not a trading result; not every IN works.
Apex (CRT execution)
Spots a complete higher timeframe CRT setup and marks the IN live, at the exact price, with your alert. Prefer a confirmed close? One click.
Apex can mark an IN intrabar, at the moment its level is traded; this is stated in its settings.
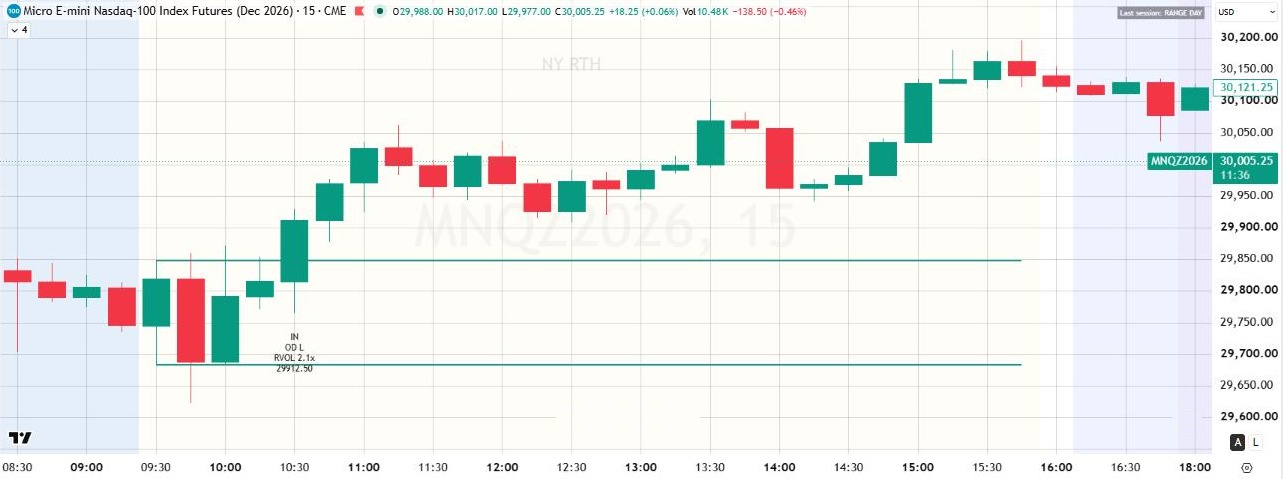
Real capture, MNQ 15 min, Oct 15, 2026. Click or tap to enlarge. Illustration only, not a trading result; not every IN works.
Opening Drive
Looks for the session's first strong move, with real participation behind it. Breakout or retest: your choice.
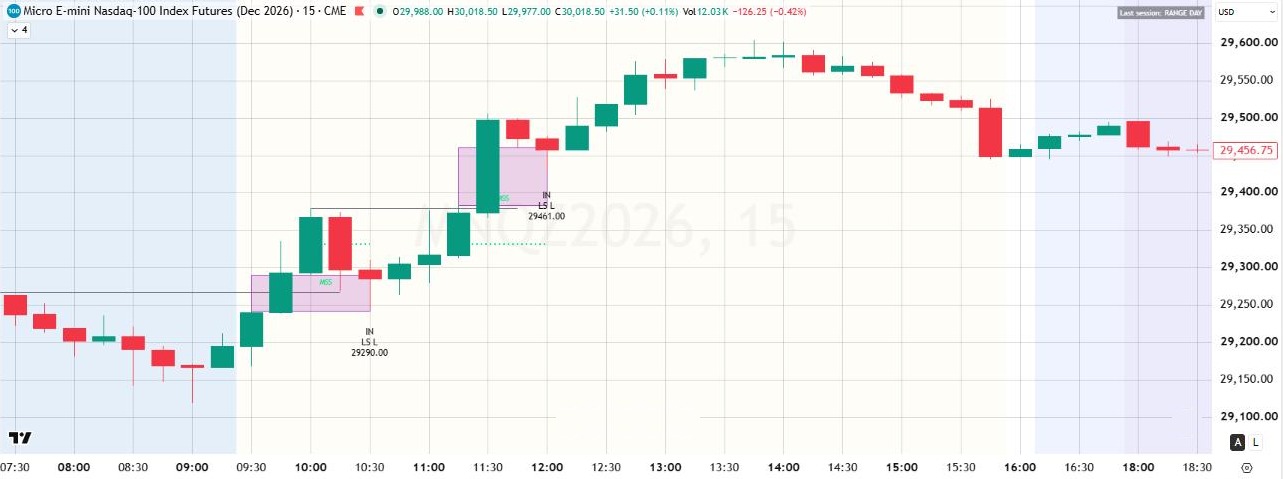
Real capture, MNQ 15 min, Sep 14, 2026. Click or tap to enlarge. Illustration only, not a trading result; not every IN works.
Liquidity Sweep
Waits for the stop hunt to finish, then marks where the real move can start, at a precise price.
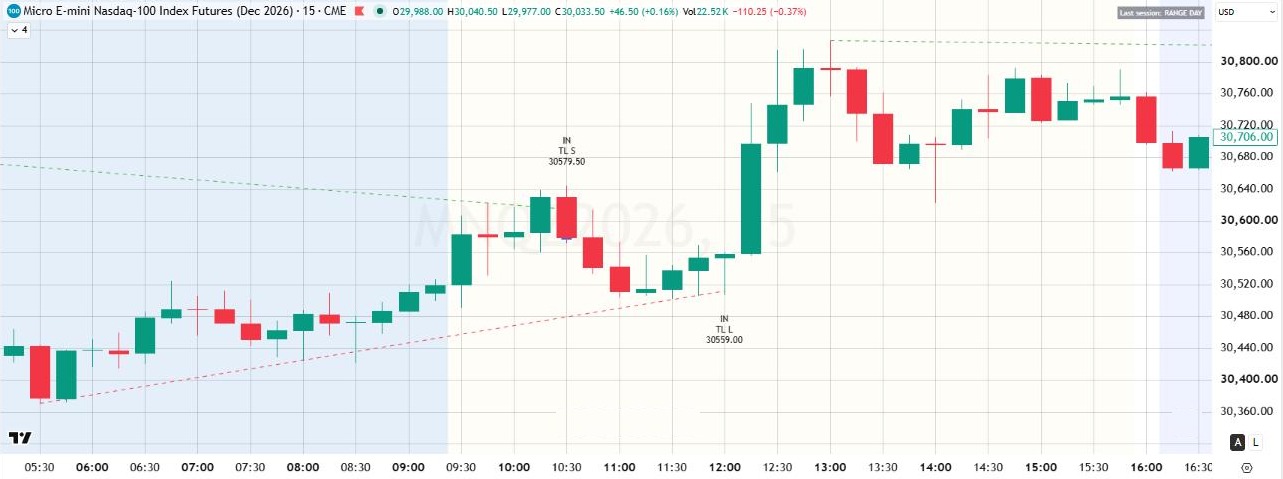
Real capture, MNQ 15 min, Sep 24, 2026. Click or tap to enlarge. Illustration only, not a trading result; not every IN works.
Trendline Retest
Turns your trendlines into precise retest INs. Every line behind every IN is drawn.
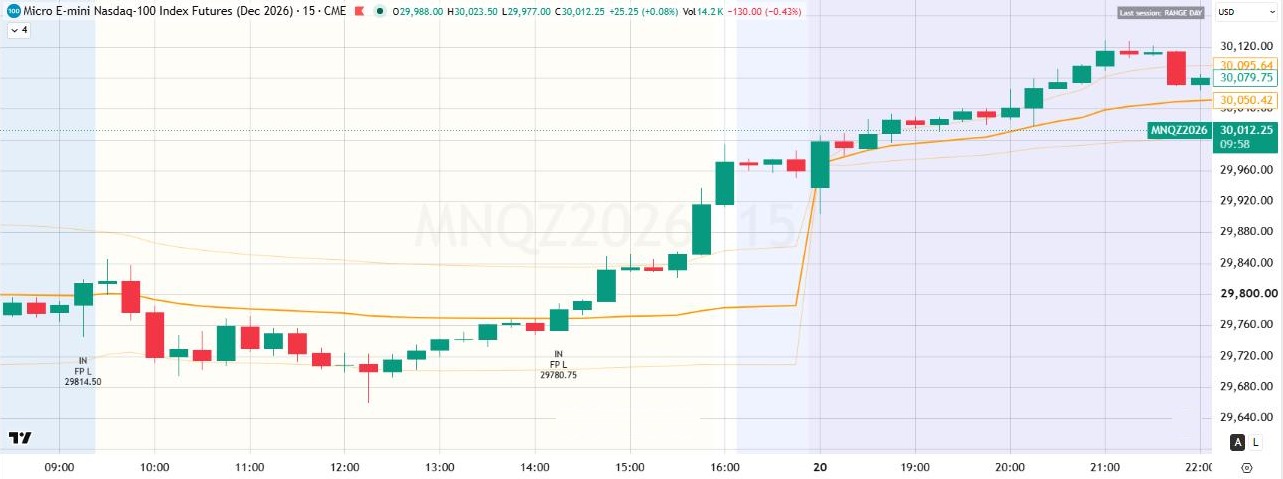
Real capture, MNQ 15 min, Sep 18, 2026. Click or tap to enlarge. Illustration only, not a trading result; not every IN works.
Fair Price Reclaim
Built for range days: marks the IN when price returns to fair value. Ready with no settings.
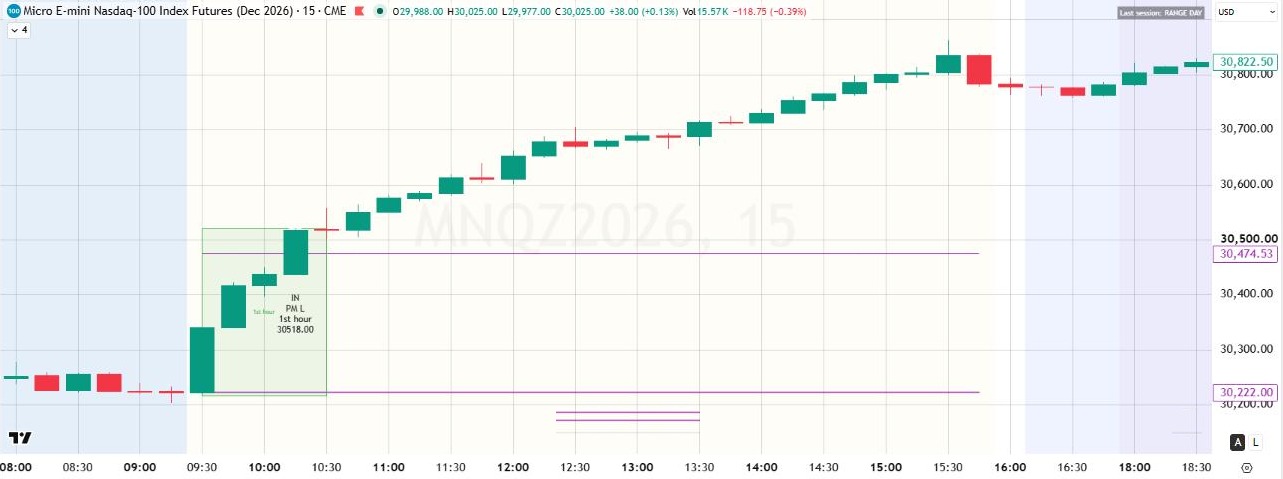
Real capture, MNQ 15 min, Sep 21, 2026. Click or tap to enlarge. Illustration only, not a trading result; not every IN works.
Power Momentum
Built for trend days: joins the move when momentum is real, and stays patient when it isn't.
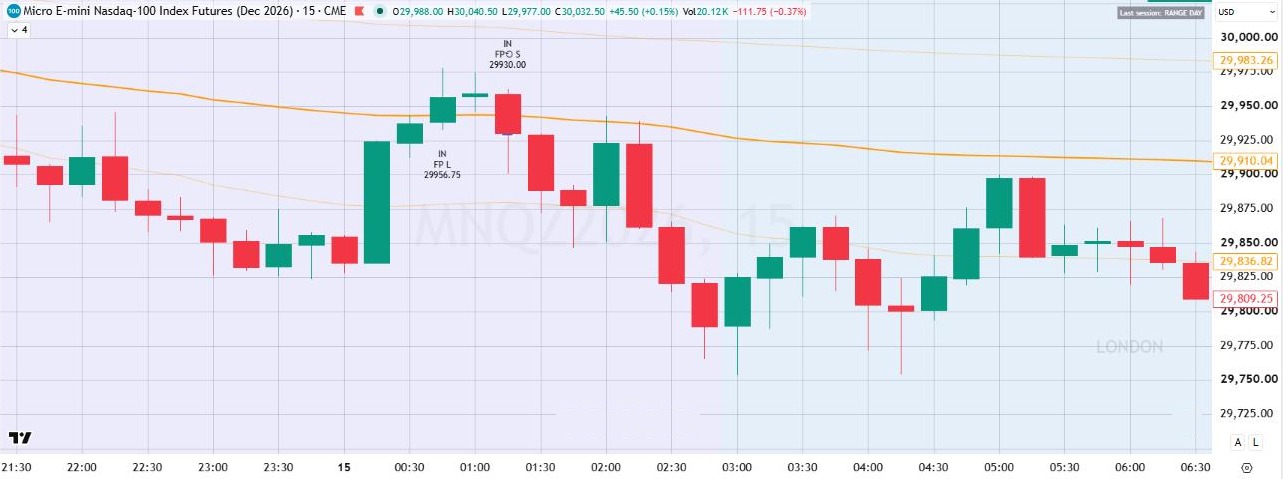
Real capture, MNQ 15 min, Oct 15, 2026. Click or tap to enlarge. Illustration only, not a trading result; not every IN works.
Trap Reversal
When a setup fails, Trap Reversal marks the move the other way. A failed setup becomes information.
Not a bot. You decide.
Trader Edge Suite is not a bot. It reads the market with you, and you stay the master of every trade. IN marks and alerts are an invitation to look, never an instruction to act. Check every one against your own plan.
No repaint. No shortcuts.
All calculations use confirmed data. Higher timeframe values are requested without lookahead, and structure, gaps and sweeps are confirmed by candle closes, so history shows what was visible in real time.
Clear about what Trader Edge Suite is, and what it is not.
A system you can trust should tell you its limits up front.
- It is a market reading system that draws structure, liquidity, imbalance, time, levels, relative strength and trendlines on your chart.
- It is not a bot, a signal service or a promise of results. It never connects to your broker and never places orders.
Limitations
- Drawings and IN markers are tools for reading the market. They are not trading advice and do not guarantee any result.
- Lower timeframe requests are limited by the platform: a module timeframe lower than the chart is hidden and a note says so.
- History shown is limited (48 hours up to one month, depending on the timeframe) to respect the platform's object and calculation limits.
- Some presets are designed for specific timeframes and sessions; their notes indicate when the chart does not fit.
- Past behavior on historical data does not guarantee future behavior.
CORE ONLY $99/MO.
Special price, limited time. Lock it in now. Your special price stays locked as long as your subscription stays active.
Yearly: Core $990/yr* · Pro $1,490/yr* (regular $1,490 · $2,490)
Get 12 months for the price of 10!
*Billed annually: Core $990/year · Pro $1,490/year.
Prices in USD. Regular prices: Core $149/month or $1,490/year, Pro $249/month or $2,490/year.
Your edge is waiting on your chart.
One system. Every layer. Every timeframe on your favorite chart. SPECIAL PRICE: Core ONLY $99/mo (regular $149/mo) · Pro ONLY $149/mo (regular $249/mo). Get 12 months for the price of 10! Your special price stays locked as long as your subscription stays active. Special price, limited time. Lock it in now.
*Billed annually: Core $990/year · Pro $1,490/year.
Prices in USD. Monthly or yearly. Cancel anytime.